Defining Intensity Ranges
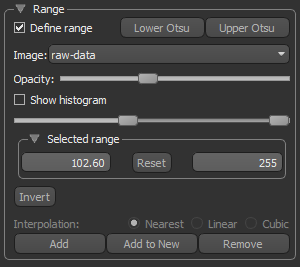
The options in the Range box on the ROI Tools panel, shown below, lets you define an intensity domain of dataset values and then apply the selected range as a threshold segmentation (see Creating Threshold Segmentations).
Defined intensity ranges can also be used to define the seeds for a Watershed computation, limit the application of the ROI Painter tools or morphological operators within a selected range, or to add or remove a range from a selected ROI or from the selected class of a multi-ROI.
Range
| Description | |
|---|---|
| Define range |
Applies an intensity domain on the 2D views of the selected dataset, which is highlighted in a constant color.
Note The highlight color can be selected in the Colors preferences (see Selecting the Colors Preferences). |
| Lower Otsu* | Automatically sets the initial range between 0 and the Otsu threshold. With each additional click, the new range will be computed within the currently selected range. |
| Upper Otsu* | Automatically sets the initial range between the Otsu threshold and the maximum data value in the selected dataset. With each additional click, the re range will be computed within the currently selected range. |
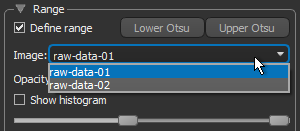
| Image |
Lets you select the image on which you want to define the intensity domain, as shown below.
Note This option is only applicable when multiple datasets are visible in the current view. |
| Opacity | Lets you adjust the opacity of the intensity domain highlight. |
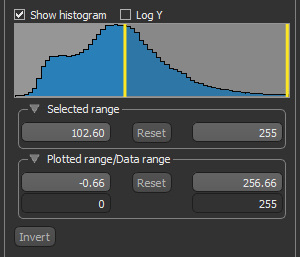
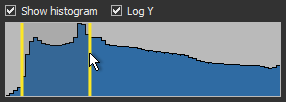
| Show histogram |
Toggles the visibility of the histogram, which shows how data values are distributed within the selected dataset.
Note You can adjust the range with left or right Range sliders (window width), as well as drag from the middle of the selected range to translate the range values (window center). Log Y… If selected, the Y-axis will be plotted in log scale. Plotted range/Data range… Indicates the range of values plotted on the histogram, as well as the minimum and maximum values within the selected dataset.
|
| Selected range |
Indicates the minimum and maximum selected threshold values.
|
| Plotted range/Data range |
Indicates the range of values plotted on the histogram, as well as the minimum and maximum values within the selected dataset.
|
| Invert | Inverts the selected range. |
| Interpolation | Lets you choose an interpolation method — Nearest, Linear, or Cubic — in cases in which you add to or remove labeled voxels from a selected region of interest that has a different geometry than the dataset on which the range is defined. |
| Add | Adds labeled voxels within the selected range to the current region of interest or to the selected class of a multi-ROI. |
| Add to New | Creates a new region of interest in which all voxels within the selected range will be labeled. |
| Remove | Removes labeled voxels within the selected range from the current region of interest or from the selected class of a multi-ROI. |
- Select the image data on which you plan to define the intensity range in the Data Properties and Settings panel.
- Select the Define range option in the Range box on the ROI Tools panel.
The full range of data in the selected dataset is applied by default.
Note If multiple datasets are visible in the current scene, make sure that the dataset that will provide the required range is selected in the Dataset drop-down menu and is the topmost image in the view.
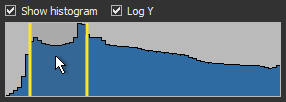
- Check the Show histogram option to plot a histogram of the intensity values, recommended.
You can scale the Y-axis in log scale by checking Log Y.
- Define the intensity range that best describes the feature(s) you need to segment or the range of data that you want to modify.
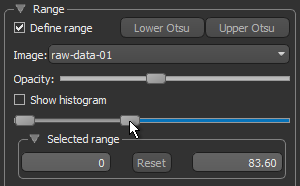
- Drag the left or right Selected range sliders to change the minimum or maximum values of the intensity range (window width).
- Drag from the middle of the Selected range sliders to translate the intensity range values (window center).
- Enter the required values in the Selected range edit boxes.
- Click the Lower Otsu button to set the range between 0 and the Otsu threshold or click the Upper Otsu button to set the range between the Otsu threshold and the maximum value in the selected dataset.
- Drag the left or right Selected range sliders to change the minimum or maximum values of the intensity range (window width).
-
